Lab Description
The purpose of this lab is to set up a kalman filter for the robot. The reason for the kalman filter is to help the robot compensate for its slow ToF sensors.
Setup
There is not real setup for this lab other than noting that I will be preforming stunt A, which is driving and a wall, doing a flip, then driving back.
Lab Sections
Part 1: Step Response:
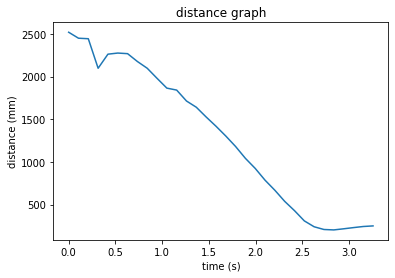
The step response was determined by driving the robot at a wall and measuring its distance to the wall, pwm values, and elapsed time. I was able to tune the PID controller well in lab 6, so the robot drives at the wall at a decent speed without crashing. This can be seen below:
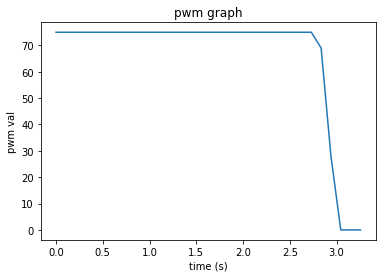
The maximum PWM signal given was 75. I seemed to reach steady state for a short period with this run as well, but it can be a little hard to tell with noise from the front sensor.
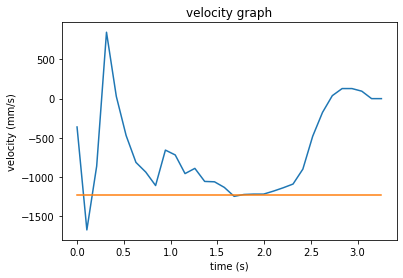
The graphs below show the ToF readings, velocity, and motor inputs respectively. The velocity graph also includes an orange line to indicate steady state.


I found the steady state speed to be 1225 mm/s. 90% of this value is about 1102 mm/s, which takes 1.1 seconds to reach. With this, I was able to compute the A and B matrices by solving for drag and mass. Drag is found by dividing the step, which is taken as 1, by the steady state speed.
Mass is then found by multiplying the 90% rise time by the drag, then dividing by the natural log of .1.
Part 2: Kalman Filter setup
To begin the kalman filter, the process noise and sensor noise must be determined. Three separate sigma values must be chosen to determine these. For now, these values have been chosen based off what was chosen in lecture. sigma1=10, sigma2=10, and sigma3=20.
The C matrix used is the one provided in the lab handout, C=[-1, 0].
Part 3: Checking Kalman Filter
The filter is checked by running it on data collected from lab 6. However, I no longer have this data, so I ended up collecting new data.
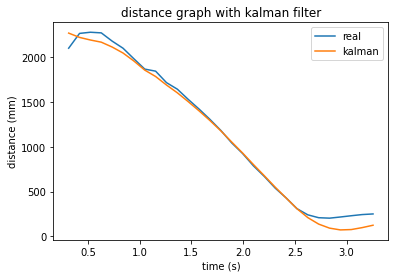
With this, I was able to run my kalman filter. The sigma values I used seemed to work well, as can be seen from the graph below.

Lab Description
Setup
Lab Sections
The maximum PWM signal given was 75. I seemed to reach steady state for a short period with this run as well, but it can be a little hard to tell with noise from the front sensor. The graphs below show the ToF readings, velocity, and motor inputs respectively. The velocity graph also includes an orange line to indicate steady state.


I found the steady state speed to be 1225 mm/s. 90% of this value is about 1102 mm/s, which takes 1.1 seconds to reach. With this, I was able to compute the A and B matrices by solving for drag and mass. Drag is found by dividing the step, which is taken as 1, by the steady state speed. Mass is then found by multiplying the 90% rise time by the drag, then dividing by the natural log of .1.
